
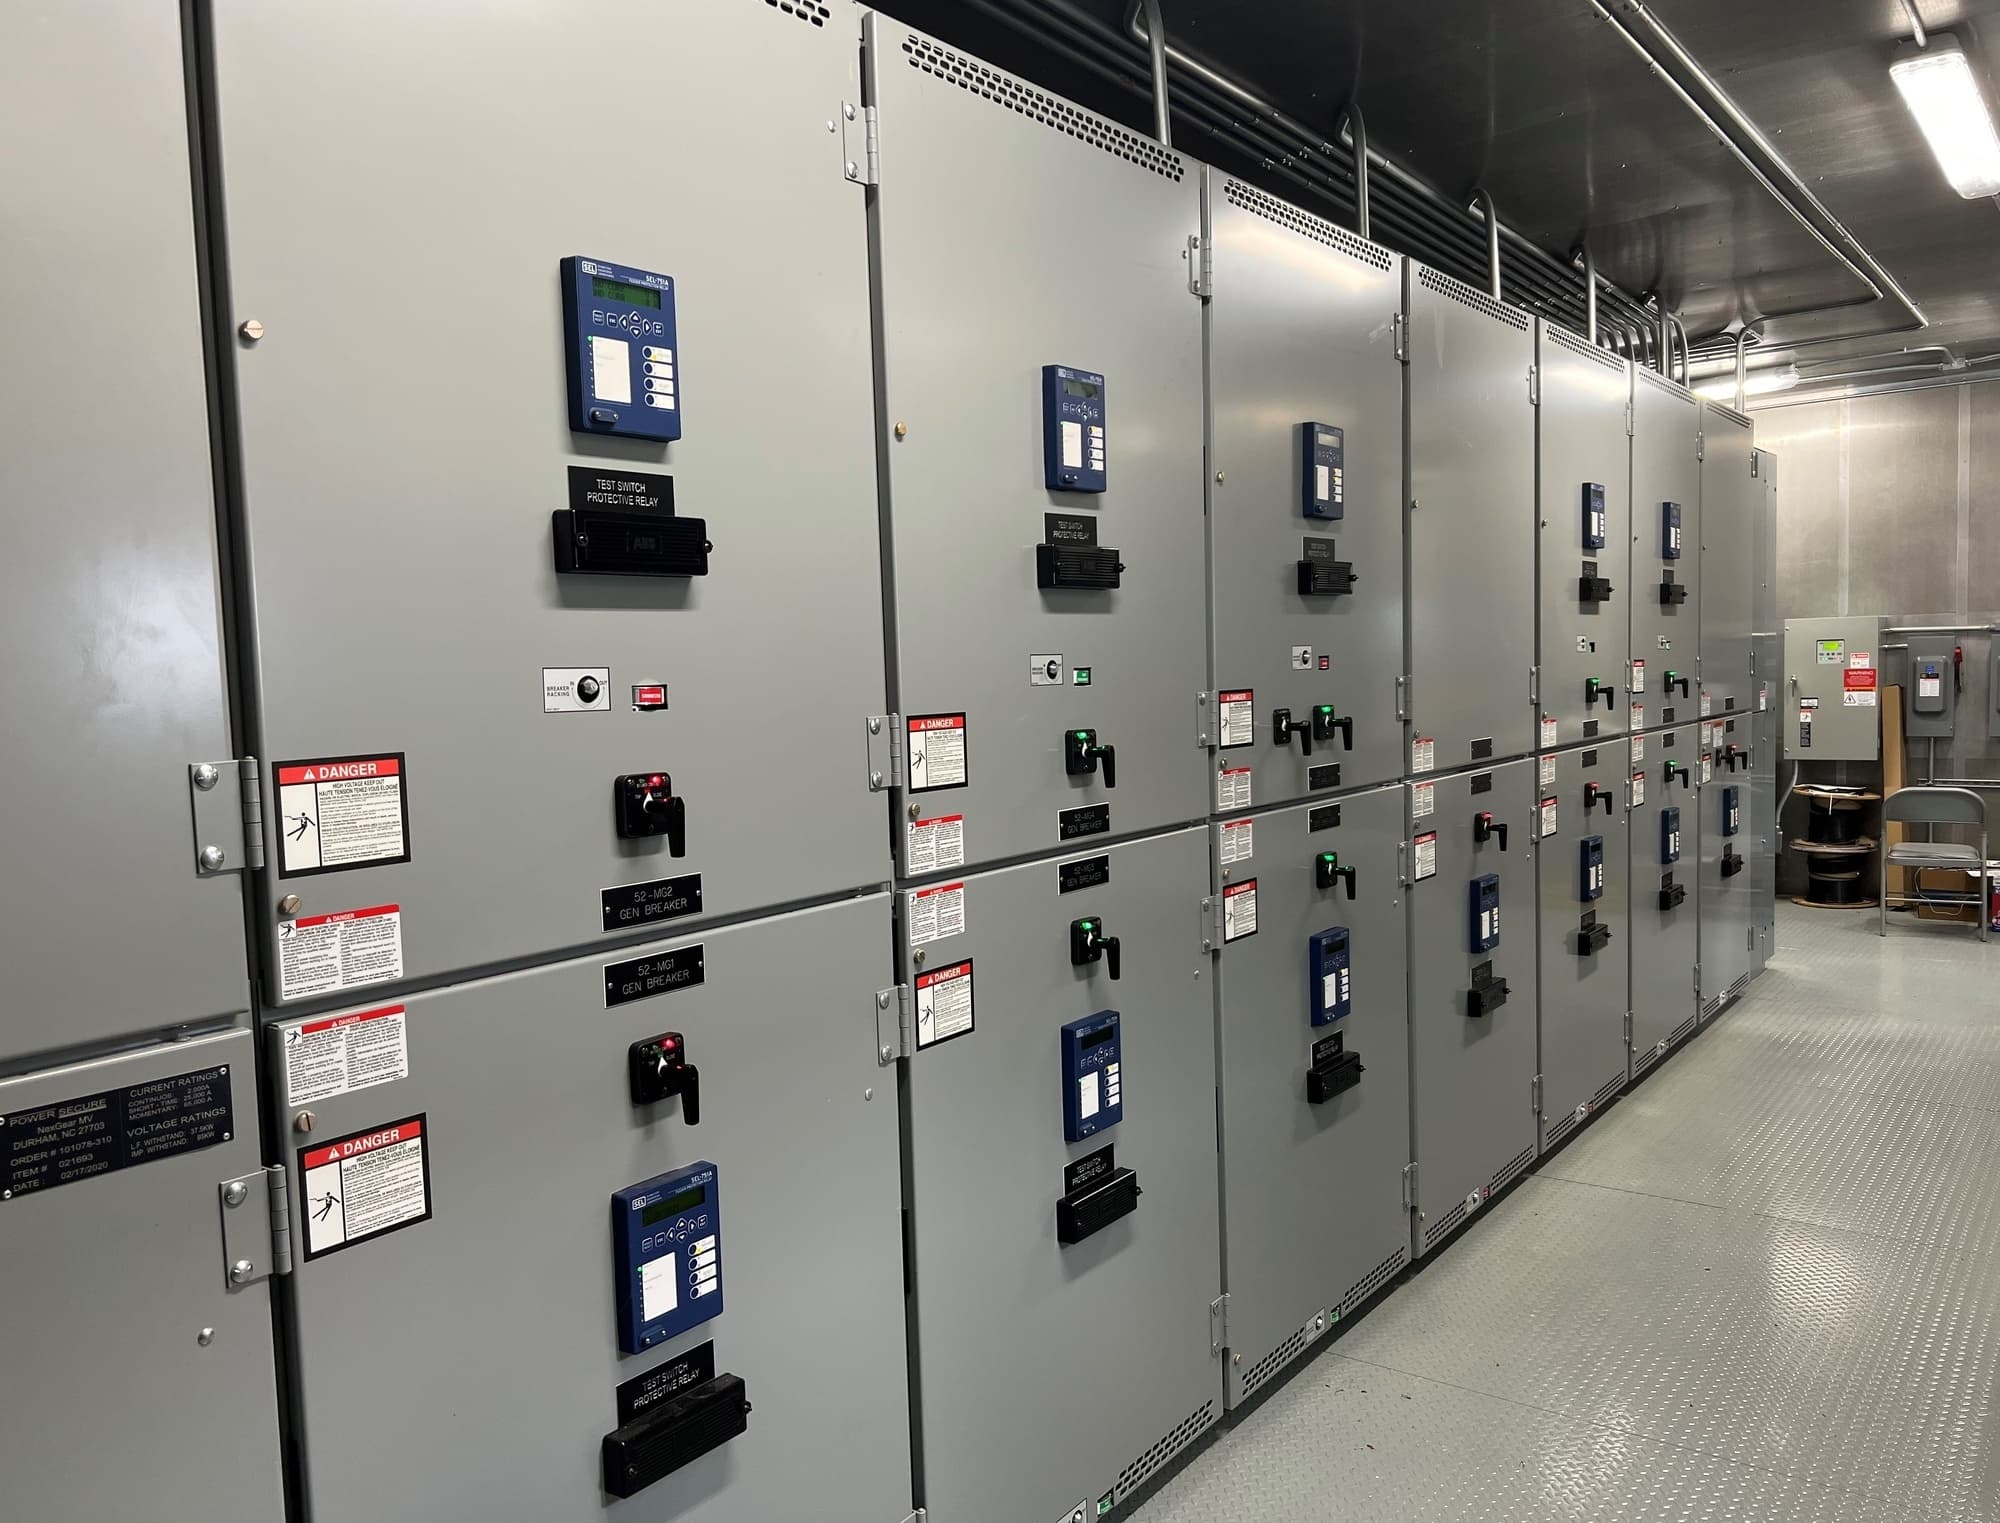
Private data center construction in the US reached $49.7 billion in 2025, up 42.9%† from $34.8 billion in 2024, according to the Census Bureau's annual value put in place table. Anirban Basu, chief economist at Associated Builders and Contractors, says the July 2026 rise in nonresidential spending was "entirely due to data centers."
This benchmark prices a data center electrician crew for the general contractor, EPC, electrical sub or developer putting a loaded labor rate into a bid. Our data center electrician salary guide covers the worker's side.
Data as of September 2026. Wages are BLS OEWS May 2025, employer costs BLS ECEC June 2026, per diem GSA FY2027 (from October 1, 2026) and tax and comp rates each state's 2026 figures.
Disclosure
Rinvio is a skilled trades staffing company based in Manhattan Beach, California, that places W-2 crews nationwide; every worker it places is its W-2 employee. Rinvio sells staffed electrical labor, so it has a commercial interest in how buyers weigh a bill rate against direct hire. This article does not quote Rinvio's own rates.
How to build a data center electrician crew cost
Start from a base wage (BLS or a union scale) and add the cost of data-center schedules, per diem if the crew travels and statutory employer burden. That gives a partial direct-hire (self-perform) cost for one journeyman. A bid needs a composite crew rate, weighted by crew mix (foremen earn a premium over journeyman scale, apprentices a percentage of it), plus fringes, general liability, small tools and non-productive time like badging, orientation and shuttles from remote parking.
A dagger (†) marks our arithmetic, explained in the method note. Anything labeled illustrative is a worked example. BLS has no data-center cut of electrician pay, so its figures cover all electricians (SOC 47-2111).
Electrician base wages by metro: BLS medians and union scale
The BLS May 2025 wage release counts 757,220 electricians, and its Table 1 puts their median at $30.38 an hour and their mean at $34.37. The BLS Occupational Outlook Handbook (updated August 27, 2026) gives an annual median of $63,190, with $57,760 in the employment services industry and $61,570 at electrical contractors. Six of the eight union rates below come from SAM.gov Davis-Bacon determinations (modified May 18, 2026) that still show 2025 effective dates, so a local may have raised pay since. Bid from the local's current wage sheet and add escalation for any raise that lands mid-project.
| Metro (BLS area) | Employed | BLS median, hourly | BLS 90th percentile | Union journeyman scale | Union scale vs BLS median† |
|---|---|---|---|---|---|
| Washington-Arlington-Alexandria (Northern Virginia) | 16,580 | $36.50 | $58.45 | $59.50, Local 26 (effective June 2, 2025) | 1.63x |
| Dallas-Fort Worth-Arlington | 20,930 | $28.37 | $39.26 | $40.65, Local 20 (effective March 1, 2026) | 1.43x |
| Phoenix-Mesa-Chandler | 17,240 | $29.43 | $41.73 | $39.09, Local 640 (July 1, 2025); $42.15† if the January and July 2026 raises scheduled on the expired July to December 2025 Local 640 wage sheet took effect | 1.33x (1.43x† at $42.15) |
| Columbus, Ohio | 7,210 | $31.11 | $45.39 | $46.00, Local 683 (hall page, September 29, 2026) | 1.48x |
| Atlanta-Sandy Springs-Roswell | 13,430 | $28.20 | $40.39 | $38.65, Local 613 (March 3, 2025) | 1.37x |
| Chicago-Naperville-Elgin | 17,720 | $49.21 | $59.65 | $57.75, Local 134 (June 2, 2025) | 1.17x |
| Omaha-Council Bluffs | 3,530 | $30.02 | $45.52 | $46.40, Local 22 (June 1, 2025) | 1.55x |
| Fargo | 920 | $36.99 | $48.23 | $37.41, Local 1426 (June 1, 2025) | 1.01x |
The ratio column compares union scale with all electricians in the metro, open shop included, so it measures the gap between union scale and the local market. It says nothing about a data-center premium. Dallas County's Davis-Bacon electrician rate ($21.51) comes from a 2014 non-union survey, so the table uses Local 20's scale. Fargo is a small sample (920 electricians).
The data-center premium is mostly premium time and incentives
We found no single published figure for the data-center premium. Indeed Hiring Lab (July 14, 2026) found that hourly installation and maintenance postings that mention data centers advertise a median 42% more than other postings in the field, about "ten dollars more per hour," and 12% more where pay is annual. That is posted pay for a whole job family.
The union job boards list the scale and the schedule on each call. On September 28, 2026, IBEW Local 20's board in Dallas listed two data-center calls at the same $40.65 scale as a hospital call; they run 6-10s or 5-10s and pay all overtime at double time if the electrician works every scheduled hour. Local 26 in Northern Virginia posted Northern Virginia data-center calls for September 29 on schedules from 40 to 60 hours a week, including three 8s and three 12s in Ashburn and Manassas and one 40-hour Ashburn call, and one call lists "$125 a day per diem." One Local 26 call, at a data center in Culpeper, Virginia, lists "paying $8 over scale," so some contractors do pay above scale, but we found no published union "data-center rate."
So the extra cost is mostly in the schedule.
The table measures premium pay per hour worked. It does not measure cost per unit installed. Long runs of 58- and 60-hour weeks tend to lower output per hour, so add an overtime productivity factor from your own job history.
| Schedule | Where posted (September 28 to 29, 2026) | Overtime multiple | Cost per hour worked vs straight time† |
|---|---|---|---|
| 5-8s, 40 hours | Local 20 hospital call (scattered overtime per the board) | None scheduled | +0% |
| 6-10s, 60 hours | Local 20 data-center call if a scheduled hour is missed (1.5x assumed; not stated on the board) | 1.5x | +16.7% |
| 5-10s plus an 8, 58 hours | Local 683, New Albany data-center call | 2x | +31.0% |
| 6-10s, 60 hours | Local 20 data-center call, all hours worked | 2x | +33.3% |
The Local 1426 calls for a data center in Harwood, North Dakota (six calls, March 27 to September 28, 2026) pay $44.80 an hour on 6-10s, an attendance incentive of $100 a weekday and $150 a weekend day, and $100 a day in per diem, non-taxed per the calls when the electrician's driver's license address is 100 miles or more from the site. Five of the six add $100 a day, tied to attendance, for a North Dakota license. On an illustrative Monday-to-Saturday week the base incentives come to $10.83† per hour worked (24%† over base) before that add-on, and the per diem to $10† an hour if paid per day worked ($11.67† if paid all seven days). The incentive is taxable wages, and 29 CFR 778.211(c) says most attendance bonuses belong in the regular rate for federal overtime. Part of the gap over the $37.41 Davis-Bacon rate is the industrial rate, which the local's May 2024 wage notice put about 15%† above commercial.
Per diem at GSA FY2027 rates
GSA Bulletin FTR 27-01 (August 18, 2026) raises standard lodging $3 to $113 and keeps standard meals and incidentals (M&IE) at $68, a standard day of $181†, for travel from October 1, 2026 through September 30, 2027. M&IE tiers run $68 to $92, and the rate follows where the work happens.
| County (area) | Lodging per night | M&IE | Daily total† | IRS high-low ($329 high, $230 low) |
|---|---|---|---|---|
| Loudoun, Virginia (Ashburn) | $121 | $80 | $201 | Low† |
| Prince William, Virginia (Manassas) | $113 (standard)† | $68 | $181 | Low† |
| Fairfax, Virginia (Washington, DC area) | $192 to $295 by month | $92 | $284 to $387 | High all year |
| Dallas, Texas | $184 | $80 | $264 | Low† |
| Maricopa, Arizona (Phoenix) | $122 to $232 by month | $86 | $208 to $318 | High Feb. to Mar. |
| Franklin, Ohio (Columbus) | $138 | $80 | $218 | Low† |
| Licking, Ohio (New Albany area) | $113 (standard)† | $68 | $181 | Low† |
| Fulton and DeKalb, Georgia (Atlanta) | $188 to $207 by month | $86 | $274 to $293 | High Jan. to Mar. |
| Cook, Illinois (Chicago) | $148 to $238 by month | $92 | $240 to $330 | High Oct. to Nov. and Apr. to Sep. |
| Pottawattamie, Iowa (Council Bluffs) | $113 (standard)† | $68 | $181 | Low† |
Local 26's $125 and Local 1426's $100 are both below the $181 standard day. Check whether per diem is owed per day worked or per calendar day; over seven days against a 60-hour week, the $181 standard day adds $21.12† per hour worked and Local 26's $125 adds $14.58†. Per diem stays out of wages only under an accountable plan, which IRS Publication 463 says needs a business connection, a timely accounting and the return of any excess. Revenue Procedure 2019-48 deems substantiated the lesser of the allowance or the federal rate, and IRS Publication 15 (2026) says any excess is wages, subject to withholding, FICA and FUTA. Publication 463 says an assignment realistically expected to last more than a year in one place is indefinite, and its living allowances are income.
Employers on the IRS high-low method can use Notice 2026-60 (September 24, 2026) for allowances paid on or after October 1, which sets $329 a day in high-cost localities and $230 elsewhere in the continental US. For October through December, Rev. Proc. 2019-48 has an employer keep the method it used for that employee earlier in the year and lets it use the old or new rates, applied consistently to all high-low employees. Our traveling electrician per diem guide covers the worker's side.
Electrician burden rate with class 5190 workers' comp
Employer FICA is 7.65% (6.2% Social Security on wages up to $184,500 in 2026 plus 1.45% Medicare with no cap), per IRS Topic 751. Net FUTA is 0.6% on the first $7,000 of wages after the full 5.4% state credit, or $42† a year per worker, per IRS Topic 759. None of the six states below is on the Labor Department's list of potential 2026 FUTA credit reductions. State unemployment (SUTA) and workers' comp differ by state.
| State | SUTA rate and wage base | Class 5190 comp, per $100 of payroll | Full-year worker† | Short assignment† |
|---|---|---|---|---|
| Texas | 2.70% on $9,000 | $0.828 (NCCI loss cost, July 1, 2026) | 8.86% | 11.78% |
| Virginia | 2.5% plus add-ons on $8,000 | $1.219 (assigned risk, April 1, 2026) | 9.19% | 11.97% |
| Ohio | 5.85% new construction on $9,000 | $1.0889 (state fund base rate, July 1, 2026) | 9.50% | 15.19% |
| North Dakota | 9.67% new construction on $46,600 | $1.50 (state fund, July 1, 2026) | 14.63% | 19.42% |
| Arizona | 2.0% on $8,000 | No public rate found (NCCI state; ask a carrier) | 7.92% before comp | 10.25% before comp |
| Georgia | 2.70% on $9,500 | No public rate found (NCCI state; ask a carrier) | 8.05% before comp | 10.95% before comp |
Statutory burden comes to roughly 9% to 19% of wages, before fringes, general liability, small tools or overhead. North Dakota is highest because new construction employers there pay 9.67% on the first $46,600. Actual premiums will differ, because Texas publishes an advisory loss cost without carrier expense loads, and the Ohio and North Dakota figures are base rates before experience rating. New Jersey's class 5190 rate, the highest we found, is $3.843 per $100 (NJCRIB, January 1, 2026), and its carpentry class 5403 is $14.946 in the NJCRIB top-20 comparison, about 3.9 times† as much.
BLS's June 2026 Employer Costs for Employee Compensation is a federal benchmark for the band. In private industry (Table 1), legally required benefits cost $3.40 an hour, 7.2% of compensation or 10.4%† of wages. In construction (Table 4) they cost $4.42, 12.2%† of wages and inside the band. All construction benefits come to $15.84 an hour on $36.13 of wages, 43.8%†. BLS will drop workers' comp from ECEC starting with December 2026 data.
What an electrician staffing markup covers
altLINE, a unit of The Southern Bank Company, puts temporary markups at 20% to 75%. Advance Partners also says 20% to 75%. The Resource Company's 2026 report says markups typically run 30% to 75% for temporary and contract placements, and its table by engagement type gives 25% to 60% on pay rate for temporary and contract work. None is specific to electricians.
Markup is a percent of pay; gross margin is a percent of the bill. At a 30% markup, $100 of pay bills at $130, and the $30 spread is 23.1%† of the bill before employer taxes. The Resource Company, compiling other firms' pricing breakdowns, puts general and administrative cost at about 18.70% of the bill rate and agency net profit at 3% to 8%.
TrueBlue and Kelly Services report gross margin after wages, payroll taxes, benefits and workers' comp, so the markup it implies is measured over loaded cost (wages plus those costs), and the markup over pay is higher. At a 12% burden (the figure in Advance Partners' worked example), PeopleReady's 33.5% over cost equals about 49.5%† over pay.
| Company and segment | Period | Gross margin | Markup over cost of services† |
|---|---|---|---|
| TrueBlue, total company | Fiscal 2025 | 22.8% | 29.5% |
| TrueBlue, PeopleReady segment | Fiscal 2025 | 25.1%† (cost of services 74.9%) | 33.5% |
| TrueBlue, PeopleReady segment | Q2 2026 | 21.3%† (cost of services 78.7%) | 27.1% |
| Kelly Services, Enterprise Talent Management | Fiscal 2025 | 19.6% | 24.4% |
Per TrueBlue's 10-K, PeopleReady is an on-demand general labor segment that also places electricians and other trades (PeopleReady Skilled Trades, RenewableWorks), so its margin blends general labor with trades. In fiscal 2025 its selling and overhead took 24.4% of revenue and segment profit was 0.7%. In Q2 2026 segment profit was 3.3%, and TrueBlue says the segment's revenue growth came primarily from its skilled businesses, "specifically the energy industry." TrueBlue's revenue includes billable travel and other reimbursable costs. On 6-10s a third of the hours are overtime, so ask how an agency bills them; overtime billed at 1.5 times the straight-time bill rate puts the markup on the half-time premium too. Ask also whether per diem passes through at cost.
Direct-hire (self-perform) cost vs a staffed bill rate
Next to the wage alone, a bill rate tends to look expensive. Compare it with burdened direct-hire cost, since employer taxes and comp fall on whoever employs the electrician.
| Route | Load on wage | Hourly cost† |
|---|---|---|
| Wage only | 0% | $40.65 |
| Direct hire, statutory burden only (Texas, full-year to short assignment) | 8.86% to 11.78%† | $44.25 to $45.44 |
| Direct hire at the BLS construction average for all benefits | 43.8%† | $58.45 |
| Staffed bill, 20% markup (altLINE and Advance Partners low end) | 20% | $48.78 |
| Staffed bill, 25% markup (Resource Company table low end) | 25% | $50.81 |
| Staffed bill, 60% markup (Resource Company table high end) | 60% | $65.04 |
| Staffed bill, 75% markup (high end of all three sources) | 75% | $71.14 |
In this illustration, a staffed bill at a 20% markup runs $3.34 to $4.53† an hour above direct hire with statutory burden only, and the gap widens as markup rises. The 43.8% BLS row is not like-for-like, because it includes paid leave, insurance and retirement a staffed electrician may not receive. The bill rate also covers the agency's recruiting, overhead and margin. The direct-hire rows leave out your own recruiting, payroll administration, time on payroll between jobs and the effect of layoffs on your SUTA experience rate; price those from your records. Neither route includes general liability or supervision. A union shop should use its wage sheet; Local 26's Davis-Bacon line carries $23.06 in fringes on $59.50, or 38.8%† of the wage.
Mike Rowe's $240,000 to $280,000 electrician figure
This is one person's account. Mike Rowe, host of Dirty Jobs, says three electricians under 30 he met at a data center in Plano, Texas, were making $240,000 to $280,000 a year, "all with as much overtime as they want" (Yahoo Finance Power Players, July 14, 2026). No payroll, employer or union record backs it. BLS puts the Dallas-Fort Worth median at $59,010 a year. Local 20's $40.65 on 6-10s with all overtime at double time comes to about $169,100† over 52 weeks; $240,000 to $280,000 would take roughly 77 to 86† hours a week, every week.
Method note and corrections
Union ratios divide union scale by the BLS metro median. Schedule cost is (40 + overtime hours × overtime multiple) ÷ total hours; per-hour incentive and per diem figures assume a 60-hour week over six days, or seven where stated, and annual pay is weekly pay × 52. GSA daily totals add lodging and M&IE. Counties missing from GSA's list take the standard rate, and from Notice 2026-60's high-cost list, $230. Statutory burden adds 7.65% FICA, 0.6% FUTA on $7,000, the state's new-employer or new-construction SUTA rate on its wage base and the class 5190 rate. The full-year column spreads capped taxes over $75,150 (BLS construction wages, $36.13 × 2,080 hours), caps North Dakota comp at $699 and leaves out Virginia's add-ons; the short-assignment column applies every rate to every dollar (a worker paid under the smallest wage base). General liability is excluded; we found no dated primary source for it as a percent of payroll. Other ratios divide one cited figure by another, hourly cost is wage × (1 + load), spread is markup ÷ (1 + markup) and markup over cost is 1 ÷ (1 minus margin), minus 1.
This update drops the July 2026 version's $8 to $15 per $100 comp rate, which Projul's burden guide gives for carpentry, the burden band built on it and figures whose source pages no longer show them.
Request a quote for your metro and scope.
This article is general information, not tax or legal advice. Check your own situation with a CPA, an enrolled agent or a lawyer.
Sources
- Annual Value of Private Construction Put in Place, U.S. Census Bureau, September 1, 2026.
- July Nonresidential Spending Growth Entirely Due to Data Centers, ABC, September 1, 2026.
- Occupational Employment and Wages, May 2025, BLS, May 15, 2026.
- OEWS Table 1, May 2025, BLS, May 15, 2026.
- Occupational Outlook Handbook, Electricians, BLS, August 27, 2026.
- OEWS May 2025 metro estimates, BLS, May 15, 2026.
- Wage Determination VA20260158, DOL, SAM.gov, May 18, 2026.
- Wage Determination AZ20260039, DOL, SAM.gov, May 18, 2026.
- Wage Determination GA20260307, DOL, SAM.gov, May 18, 2026.
- Wage Determination IL20260009, DOL, SAM.gov, May 18, 2026.
- Wage Determination NE20260057, DOL, SAM.gov, May 18, 2026.
- Wage Determination ND20260013, DOL, SAM.gov, May 18, 2026.
- Wage Determination TX20260241, DOL, SAM.gov, May 18, 2026.
- Update on Contract, CIR Decision, IBEW Local 20, February 27, 2026.
- Job Calls and Dispatch, IBEW Local 20, September 28, 2026.
- Inside Wireman Job Calls, IBEW Local 26, September 29, 2026.
- Inside Wage and Benefit Sheet, Arizona Chapter NECA and IBEW Local 640, July 1, 2025.
- Available Calls, IBEW Local 683, September 29, 2026.
- Job Calls, IBEW Local 1426, calls posted March 27 to September 28, 2026 (accessed September 29, 2026).
- Journeyman Wage Increase, IBEW Local 1426, May 30, 2024.
- Hiring for the Data Center Build-Out, Indeed Hiring Lab, July 14, 2026.
- GSA Per Diem Bulletin FTR 27-01, GSA, August 18, 2026.
- FY 2027 per diem, Virginia, GSA, September 29, 2026.
- FY 2027 per diem, Texas, GSA, September 29, 2026.
- FY 2027 per diem, Arizona, GSA, September 29, 2026.
- FY 2027 per diem, Ohio, GSA, September 29, 2026.
- FY 2027 per diem, Georgia, GSA, September 29, 2026.
- FY 2027 per diem, Illinois, GSA, September 29, 2026.
- FY 2027 per diem, Iowa, GSA, September 29, 2026.
- Notice 2026-60, IRS, September 24, 2026.
- Revenue Procedure 2019-48 (IRB 2019-51), IRS, December 16, 2019.
- Publication 463 (2025), IRS, April 30, 2026.
- Publication 15 (2026), IRS, April 30, 2026.
- 29 CFR 778.211, eCFR, current as of September 29, 2026.
- Topic No. 751, Social Security and Medicare Rates, IRS, September 24, 2026.
- Topic No. 759, Form 940 (FUTA), IRS, September 24, 2026.
- FUTA Credit Reductions, DOL, September 11, 2026.
- UI Tax Rates, Texas Workforce Commission, rate year 2026.
- Your 2026 Tax Rates, Texas Workforce Commission, rate year 2026.
- Tax Rates FAQ, Virginia Employment Commission, September 29, 2026.
- Wage Base FAQ, Virginia Employment Commission, September 29, 2026.
- 2026 Rate Details, Ohio JFS, rate year 2026.
- 2026 UI Tax Rate Schedules, Job Service North Dakota, rate year 2026.
- A.R.S. 23-729, Arizona Legislature, September 29, 2026.
- A.R.S. 23-622, Arizona Legislature, September 29, 2026.
- Employer UI FAQs, Georgia Department of Labor, September 29, 2026.
- 2026 Texas Loss Costs, Texas Department of Insurance, July 1, 2026.
- Virginia Workers Compensation Rate Pages, Virginia SCC, April 1, 2026.
- OAC 4123-17-06, Appendix A, State of Ohio, May 26, 2026.
- Manual Rates 2026/2027, ND WSI, April 16, 2026.
- Rate and Classification Handbook 2026, NJCRIB, January 1, 2026.
- NJ Rate Comparison, Top Twenty Classes, NJCRIB, January 1, 2026.
- Employer Costs for Employee Compensation, June 2026, BLS, September 9, 2026.
- ECEC Table 1, BLS, September 9, 2026.
- ECEC Table 4, BLS, September 9, 2026.
- Staffing Agency Markup Rates, altLINE, April 11, 2025.
- Staffing Agency Bill Rate Calculator, Advance Partners, January 27, 2026.
- Average Staffing Agency Markup, 2026 Report, The Resource Company, June 11, 2026.
- TrueBlue Form 10-K, fiscal 2025, TrueBlue (SEC EDGAR), February 18, 2026.
- TrueBlue Form 10-Q, quarter ended June 28, 2026, TrueBlue (SEC EDGAR), August 4, 2026.
- Kelly Services Form 10-K, fiscal 2025, Kelly Services (SEC EDGAR), February 12, 2026.
- Mike Rowe: Gen Z electricians are making up to $280,000, Yahoo Finance, July 14, 2026.
- Construction Labor Burden Calculation Guide, Projul, March 27, 2026.